|
| MORE INFORMATION - City block approach |
|
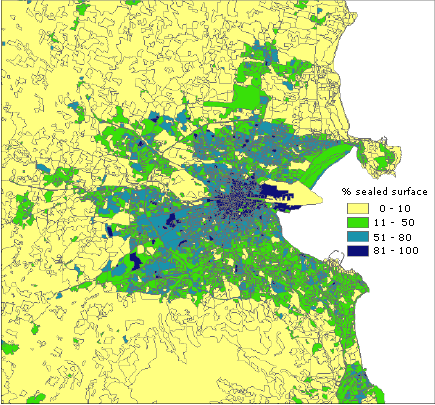
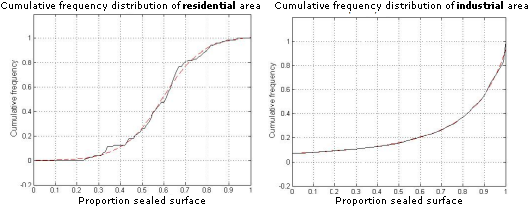
For the Dublin study area, we used city blocks as the elementary spatial units for which metrics are calculated. These blocks were created by intersecting road network data with the MOLAND land-use map of 2000, which provides areas that are relatively homogeneous in terms of land-use. For each city block, the average fraction of built-up surfaces was calculated from the sealed surface maps developed in work package 2 . The blocks were then divided into four classes according to their degree of soil sealing. The boundaries of these four urban density classes were based on definitions found in the MOLAND land use scheme. The map on the left shows the built-up density classes. The pattern of a sprawled city with a densily built-up central business district clearly emerges. To characterize the city blocks in terms of their functional properties, we developed two types of spatial metrics. A first type is based on the composition of each city block with respect to sealed surfaces. The cumulative frequency distribution of the per-pixel sealed surface fraction taken from the impervious surface map was determined for each city block (see figures below).
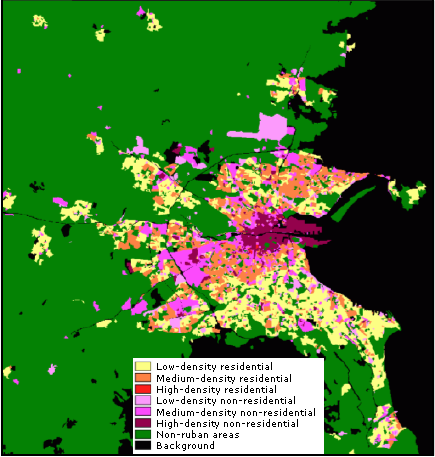
The shape of the distribution function gives an indication of the land-use type the city block belongs to. It does so because some land use types have a distinct built-up surface composition on the sealed surface maps derived from medium resolution satellite images. Low or medium dense residential areas, for instance, are typically composed of mixed built/vegetation pixels because the spatial scale of single family housing is small compared to the resolution of the image pixels. This results in a sigmoidal distribution function (above, left). Industrial areas on the other hand contain little vegetation cover and higher sealed surface fractions, which is reflected by a different distribution shape (above, right). To capture the shape characteristics of the distribution curves, a sigmoidal function was fitted to them with nonlinear least-squares regression. The cumulative distribution function only represents city block characteristics related to composition. It does not reflect the spatial configuration of built-up surface fractions. A second type of metric was therefore used to represent structural properties. Two specific metrics were used for this purpose: spatial variability and Moran's I, a measure of spatial autocorrelation. Population density determined from a dasymetric map derived through census data completes the list of variables. The parameters of the cumulative distribution function, the spatial configuration metrics, the overall proportion of sealed surfaces and the total population of each city block were then used as a signature in a supervised classification approach to assign each city block to one of five land-use types: residential areas, industrial areas, services, commercial zones and urban green. Intersecting this classification with the built-up density map and aggregating all non-residential land-use types provides the urban land-use map shown on the left. The approach outlined above can readily be applied on sealed surface maps that were produced for any time slice within our time-series. This provides us with useful morphological and functional information when detailed land-use maps are not available.
|
![]()
|
Last modification date =
13-07-2009
|